


All Aboard! New Matchday Bus Routes

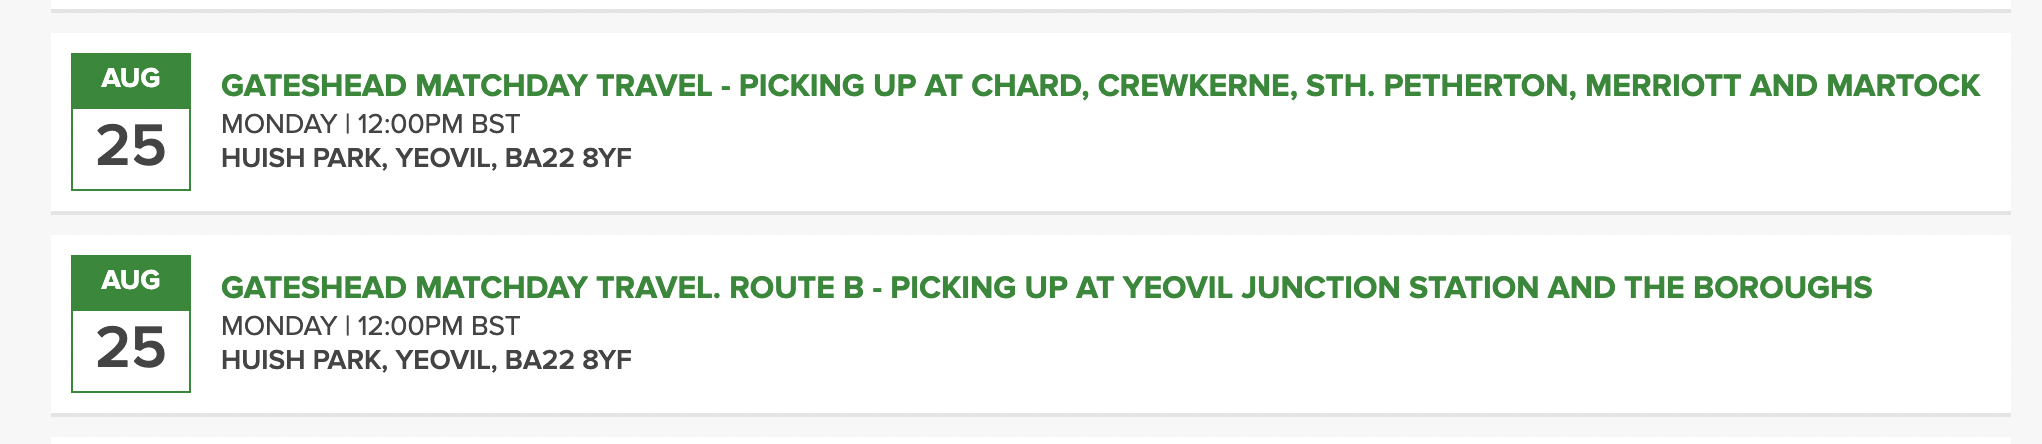
Yeovil Town have confirmed the launch of trial bus services, starting with the home clash against Gateshead on Monday 25th August. (3pm Kick Off)
The buses are designed to ease congestion around the ground, provide a greener way to travel, give fans the freedom to enjoy a pre-match pint, and make life simpler for families and older supporters or those who might otherwise struggle to travel to the game, particularly given it’s a Bank Holiday.
There are two planned routes; one from Chard, the other from Yeovil Junction train station.
Details are below, please note YOU must buy your ticket ahead of time, before 12:00 on Sunday 24th August, to be precise.
Route A: Chard – Crewkerne – Merriott – South Petherton – Martock – Huish Park
Outbound
-
Chard (Guildhall) – 12:30
-
Crewkerne (The George) – 12:50
-
Merriott (Texaco Garage) – 12:55
-
South Petherton (The David Hall) – 13:10
-
Martock (The Pinnacle) – 13:15
-
Arrive Huish Park – 13:25
Return
-
Leave Huish Park – 18:10
-
Martock – 18:20
-
South Petherton – 18:25
-
Merriott – 18:35
-
Crewkerne – 18:40
-
Back to Chard – 19:00
Route B: Yeovil Junction – Town Centre – Huish Park
Outbound
-
Yeovil Junction Station – 13:50
-
The Borough (Town Centre) – 14:00
-
Arrive Huish Park – 14:15
Return
-
Leave Huish Park – 17:30
-
The Borough – 17:45
-
Yeovil Junction – 17:55
Tickets
Supporters can book their seat for £5 return, no matter which stop you use.
-
All tickets need to be purchased in advance. Click HERE
-
Sales close at 12:00 midday on Sunday ahead of the Gateshead match.
-
Available now through the club’s online ticketing system.